
Where the shade falls. At any point, at any moment.
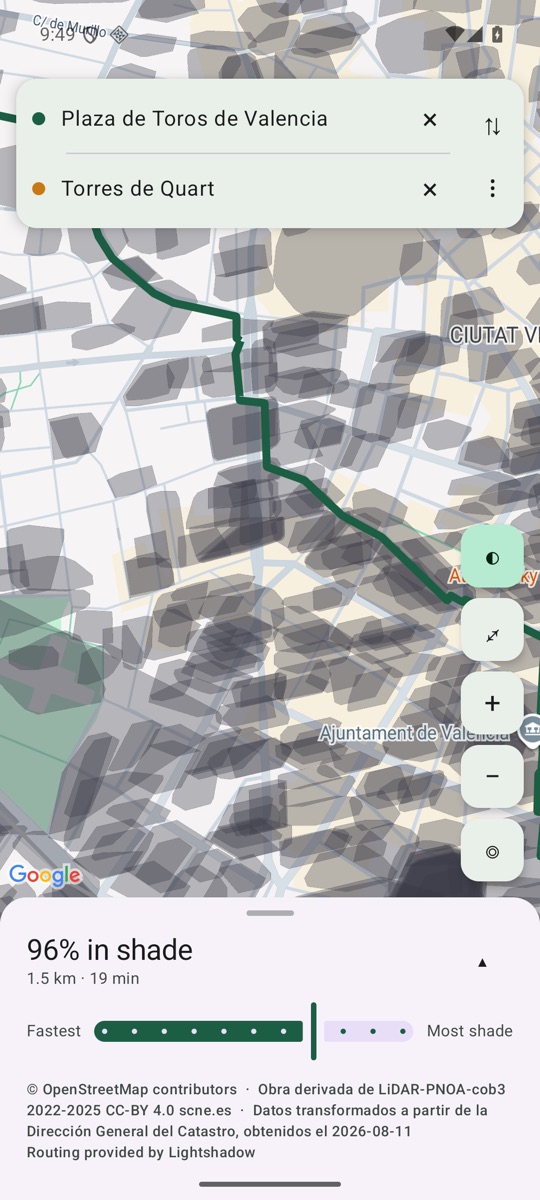
Lightshadow computes whether direct sun reaches a point of the street, from the measured geometry of buildings and tree crowns. For one point or a whole city, for one instant or a whole year.
One question, three scales
Does direct sun reach this spot? The model answers it for a single point, for any set of points and for any span of time.
A point, a moment
Is this corner in the sun at 15:00 on 15 July?
Answer: sun or shade.
Many points, a moment
Which pavement of this street is shaded at 18:00?
A street, a barrio, a route, any polygon.
Answer: the share in shade.
Any span of time
How many hours of direct sun does this street get in a year?
A day, a season, a year.
Answer: hours of sun.
Always direct sun under a clear sky: the model knows nothing about clouds.
Who the model is for
Where knowing sun and shade street by street turns into decisions.
Applications for business
- Provide an API for developers of specialised software and for engineering and architecture firms, so that shadow and solar-exposure data become a design parameter in urban planning, BIM and GIS workflows.
- Supply datasets and analytics to marketing and advertising agencies, to time outdoor campaigns, place out-of-home media and understand where and when people actually walk in sun or shade.
- Help beverage, ice-cream and sun-care brands forecast demand and choose locations for vending points, kiosks and pop-up promotions.
- Support insurers with solar-exposure and heat-stress indicators for risk models, product design and prevention programmes, including cover for outdoor workers.
- Inform real-estate developers, brokers and property portals with insolation and shade data for site selection, pricing and sunlight ratings of apartments, terraces and courtyards.
- Support delivery, micromobility and ride-hailing operators in planning routes, parking and pick-up points that account for sun exposure.
Applications for city authorities
- Diagnose the shade level of streets and public spaces to prioritise renaturalisation and green-infrastructure actions in neighbourhoods.
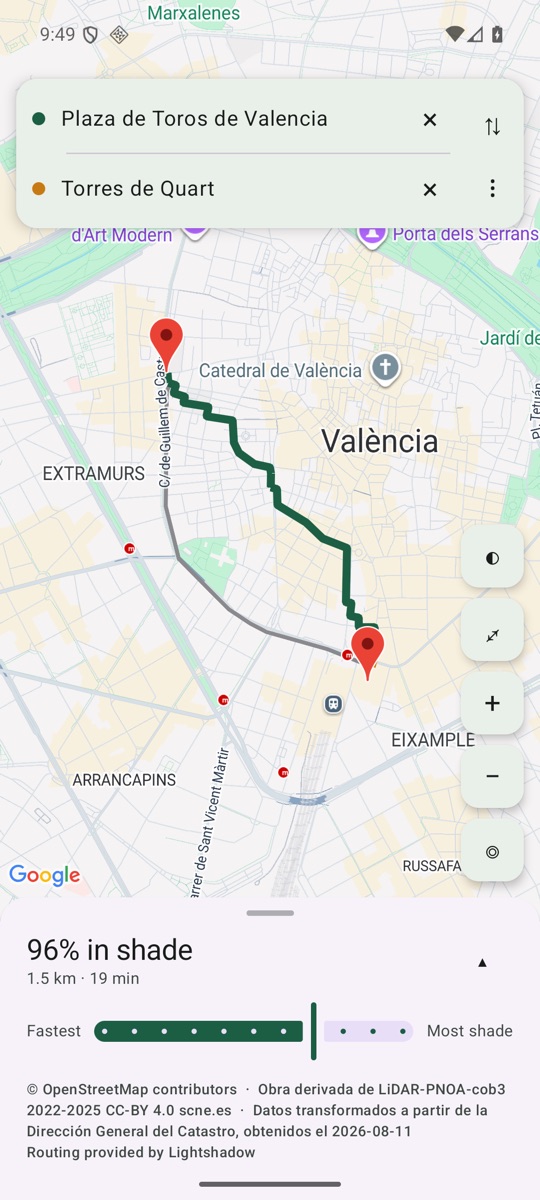
- Help residents and visitors plan walking trips with greater thermal comfort and less solar exposure, encouraging active and healthy lifestyles, including outdoor cultural, festive and sporting activities.
- Incorporate solar exposure as a criterion in planning active mobility, micromobility and new sustainable mobility modes.
- Plan outdoor municipal services (maintenance, roadworks and street cleaning) using data-driven criteria that account for staff and residents’ solar exposure.
- Develop shade and solar-exposure indicators disaggregated by neighbourhood and district, integrable into the city’s indicator system, to assess the impact of renaturalisation and other municipal actions.
- Support the municipal response to extreme climate events (heat episodes and intense solar radiation) with particular attention to vulnerable groups and differences between neighbourhoods.
- Offer shaded routes to nearby services, within the 15-minute walkable city model.
What makes this model different
València, the whole municipality
Today the model covers one city. Every figure comes from a single run and says when it was measured.
Computation profile of 4 October 2026, report of 5 October 2026. The 12.2% is crown geometry, not shade at an hour.
What the model does not do yet
- It has not been checked on the street with an instrument. Every figure is a model figure.
- Clear sky only: clouds are not in the calculation.
- Awnings, parasols and temporary structures are invisible to it.
- Tree crowns are a single snapshot: no seasons, no leaf fall.
- At low sun, tree shade is overstated.
- Building geometry is simplified.
Street data © OpenStreetMap contributors, available under the Open Database License (ODbL). The routing graph is a derivative database of OpenStreetMap; the method by which it is built is published at lightshadow.app/method/graph/en/, as section 4.6(b) of the ODbL requires.
Derived from LiDAR-PNOA-cob3 2022-2025 CC-BY 4.0 scne.es — Instituto Geográfico Nacional.
Derived from MDS05 2008-2015 and MDT05-cob1 2008-2015 CC-BY 4.0 scne.es — Instituto Geográfico Nacional.
Dirección General del Catastro. Data obtained on 17 September 2026, transformed. All rights reserved (licencia-tipo, Ley 37/2007). The derived product shown here is not cartografía catastral and not información catastral.
Vorades / Bordillos and Barris / Barrios i Districtes / Distritos, CC BY 4.0.
Base map and place search: Google Maps Platform, shown inside the app under Google's terms. Web version, fallback map: tiles by OpenFreeMap, © OpenMapTiles, data © OpenStreetMap contributors.
Why we created it and who we are
Two of the three team members have been living in Valencia for more than three years. Our children were born here. As newcomers, we found the summer a real challenge. We tried to walk in the shade and, at some point, we thought: what if we created an app for planning routes through shaded areas? And so we did.
To make it happen, we had to develop a model to calculate sunlight and shade. We also invited another acquaintance to join us, who now lives in Vietnam and faces similar problems.
Who we are
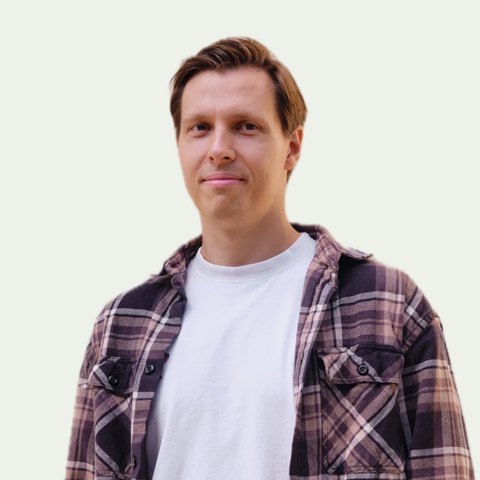 Nick KhromushkinCTO
Over 15 years in technology.
 Nick DulnevCEO
Over 15 years in management, over 5 years in fundraising and over 20 years in media.
 Dan PototskyCMO
Over 15 years in international marketing, sales and public relations.
Talk to us
Press, investors, city councils, data or the app: write to us.
- info@lightshadow.es
- Press
- press@lightshadow.es